Dev Logs / 6 min read
🛠️ When the Numbers Don't Lie: JetBrains Tests an AI Token-Saving Tool and Demystifies Go's Heap Allocations
Two very different JetBrains articles dropped on the same day — and together they say something bigger about where developer tooling is headed in 2026. One is a myth-busting benchmark that should make every Claude Code user pause before installing the next "save 90% on tokens" tool. The other quietly makes one of Go's most confusing compiler behaviors actually visible in your editor. 👀
🧪 Does "rtk" Really Cut Claude Code Token Costs by 60–90%? JetBrains Tested It — and the Answer Will Surprise You

JetBrains ran a paired A/B benchmark to test rtk's advertised 60–90% token savings claim. Source: The JetBrains Blog.
If you use Claude Code, you've probably seen rtk ("Rust Token Killer") floating around — a CLI proxy that intercepts your agent's Bash commands and compresses the output before it ever reaches the model. The pitch is simple and genuinely appealing: instead of the model reading eleven lines of git status porcelain, it gets * master / M a.txt / ?? b.txt. The README promises 60–90% less token consumption.
JetBrains decided to actually test that claim — not with a quick demo, but with a proper paired A/B benchmark on real agentic coding tasks. This is Part 2 of a series that already humbled one tool: in Part 1, a "talk like a caveman" compression skill advertised a 65% savings and delivered... 8.5%.
So how did rtk do? 📉
The advertised number: 60–90% savings.
*The measured number: +7.6% more expensive at low reasoning effort (a statistically real result, p=0.004), and roughly flat (±0%)* at high reasoning effort.
Not a smaller win. An actual cost increase, in the arm that was supposed to save money.
Why the gap is so big
The core problem isn't that rtk's compression doesn't work — it genuinely does, and JetBrains found the filtering "real and often elegant." The problem is what it can actually touch. Claude Code reads files and searches code with built-in tools that completely bypass rtk's Bash-interception hook. Once you account for how much of a real session isn't Bash output at all, the theoretical ceiling for rtk's benefit works out to roughly 3% of input tokens — nowhere close to 60–90%.
Worse, rtk's own built-in dashboard reported 96.2 million tokens "saved" — 99.8% of everything it touched — while the actual bill for those same trials went up. The tool's self-reported savings assume the model would have received the full raw, untruncated output otherwise. But Claude Code already truncates massive outputs on its own, and most of a session's real cost comes from cached context re-reads, which are billed at a tenth of the price of fresh tokens. The scoreboard was grading its own homework. 🧮
The good news: task quality was statistically identical with or without rtk, so at least the tool isn't silently breaking your builds — it's just not saving you the money it claims to.
The takeaway that matters beyond this one tool: a tool's self-reported "tokens saved" number is a claim about its own counterfactual, not a claim about your actual invoice. If you're evaluating any context-compression add-on for your AI coding agent, measure the paired bill — not the tool's internal dashboard. 💡
🔍 Escape Analysis in Go, Finally Made Visible: What's New in GoLand
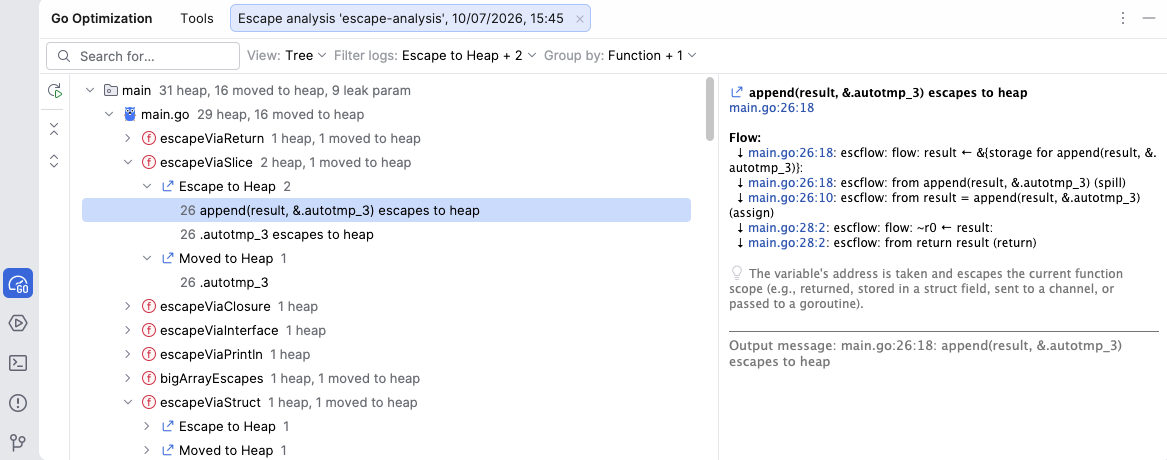
GoLand's Go Optimization tool window surfaces escape analysis results by file, function, and message type. Source: The JetBrains Blog.
The second piece is a deep, practical explainer on one of Go's most quietly confusing behaviors: escape analysis — the compiler's decision about whether a value lives on the fast, short-lived stack, or gets pushed to the slower, garbage-collected heap.
Go deliberately hides this decision from you. That's the whole point of the language's memory model — you're not supposed to need to know. But when you do need to know — because you're chasing GC pressure in a hot loop or a high-throughput service — the only way to see what the compiler actually decided has traditionally been digging through raw, noisy terminal output from a flag most Go developers have never touched:
go build -gcflags="-m" ./...The output looks something like:
./user.go:6:2: moved to heap: u
./user.go:7:9: &u escapes to heap
Useful, but brutal to work with at scale — the messages are keyed by file, line, and column, mixed in with inlining notes and other diagnostics, and disconnected from your actual editor. You end up bouncing between terminal and code, losing focus each time.
What actually causes a value to escape
The article breaks down the handful of recurring patterns worth recognizing:
- 📤 Returning pointers — the classic case. A local value's address outlives the function, so it can't stay on a stack frame that's about to disappear.
- 🔄 Closures and goroutines — if a goroutine can outlive the function that spawned it, anything it touches has to be assumed reachable indefinitely.
- 🎭 Interfaces and dynamic values — boxing a concrete value into an
interface{}(common in logging and formatting) can trigger an escape, though not always — the compiler keeps getting smarter about this. - 🗃️ Slices, maps, and structs — storing a pointer inside a data structure that outlives the current function drags the pointed-to value along with it.
None of this means escapes are bugs to eliminate on sight. As the article puts it plainly: programs of any real complexity will always have things living on the heap, and chasing every escape is a losing game that costs you readability for no measurable gain.
Where GoLand comes in
This is where the second half of the story gets genuinely useful: GoLand 2026.2 built a dedicated Go Optimization tool window that runs the same compiler flags under the hood, but parses the raw output and surfaces it directly in your editor — gutter markers next to the exact line, hover tooltips explaining why a value escaped, and a filterable results view so you're not wading through inlining noise to find the one allocation you actually care about. You can scope analysis to a single file (handy for something like an isolated AWS Lambda handler) or a whole package, and rerun after a fix to confirm the allocation actually moved.
The practical checklist the article closes with is worth keeping on hand regardless of which IDE you use: *measure first, focus on hot paths only, understand the why before you refactor, and always re-verify with profiling* — escape analysis tells you what the compiler decided, not whether that decision is actually hurting you.
🎯 The Common Thread
Read together, these two pieces make the same underlying point from opposite directions: don't trust a tool's own scoreboard — verify against reality. rtk's dashboard said 96 million tokens saved while the invoice said otherwise. Escape analysis logs tell you what the compiler decided, not whether it's actually costing you performance. In both cases, the fix is the same discipline: measure the thing that actually matters, not the thing the tool wants you to look at. ✅
Sources: JetBrains AI Blog, JetBrains GoLand Blog